---
title: "Measuring Institutions with the Worldwide Governance Indicators"
description: "How the World Bank's Worldwide Governance Indicators turn a contested concept into six numbers: what the aggregation procedure assumes, which conception of good governance the dimensions encode, how to get the data into R, and what a correlation between governance scores and development outcomes can and cannot establish."
author: "Claudius Gräbner-Radkowitsch"
date: 2026-09-25
date-modified: 2026-09-25
image: ../assets/images/placeholder.png
learning-objectives:
- "Describe the six WGI dimensions and explain how hundreds of underlying sources are aggregated into a single score with an associated uncertainty measure"
- "Download WGI estimates from the World Bank API and join them to development outcomes on ISO-3 codes"
- "Identify the conception of good governance the WGI encode, and name institutional dimensions they systematically omit"
- "Judge what a cross-country correlation between governance scores and development outcomes can and cannot establish"
categories:
- measurement
- indicators
- institutions
- R
- visualization
- tutorial
- BA
- MA
level:
- BA
- MA
content-type: tutorial
citation:
id: graebner2026-measuring-institutions-wgi
type: entry-encyclopedia
container-title: "Method and Inquiry"
title: "Measuring Institutions with the Worldwide Governance Indicators"
editor:
- name: "Claudius Gräbner-Radkowitsch"
url: https://euf-methodology-hub.netlify.app/resources/measuring-institutions-wgi
---
# Introduction
How do you measure something as abstract as "institutions"? The outcomes of
institutional arrangements are observable enough — growth rates, protests,
corruption scandals — but the quality of the arrangements themselves is not.
And unlike life expectancy or GDP, there is no agreed unit. Even the definition
of an *institution* differs across research traditions, which means that any
number claiming to measure institutional quality has already taken a position
in a theoretical dispute before the first observation is collected
[more details in @hodgson19].
The **Worldwide Governance Indicators** (WGI), produced by the World Bank since
1996, are the most influential attempt to produce such a number anyway. They
cover more than 200 countries and territories along six dimensions, and they
are used in aid allocation, investment risk assessment, and a very large
empirical literature on institutions and development.
This page treats the WGI as a worked example of the general problem set out in
[The Theory-Ladenness of Observation](theory-ladenness-of-observation.qmd):
a contested concept, a chain of choices from concept to number, and a result
that looks objective precisely because those choices are no longer visible in
the final score. The aim is not to reject the indicators — they carry real
information — but to use them knowing what they encode.
::: {.callout-note}
## What you need
Basic R and the tidyverse. The data-handling patterns used here — caching a
download, filtering out regional aggregates, joining on ISO-3 codes — are
explained in
[Accessing Development Data in R](accessing-development-data-in-r.qmd).
:::
```{r}
#| label: setup
#| code-summary: "Packages and the caching helper"
library(WDI)
library(dplyr)
library(tidyr)
library(purrr)
library(readr)
library(tibble)
library(ggplot2)
library(ggpubr)
library(kableExtra)

wdi_cached <- function(indicators, file, ...) {
  path <- file.path("data", file)
  if (!file.exists(path)) {
    message("Cache miss - downloading from the World Bank API ...")
    write_csv(WDI(indicator = indicators, ...), path)
  }
  out <- read_csv(path, show_col_types = FALSE)
  # Guard against a retired indicator code (which returns silently without its
  # column) and against a cache file written by a different query
  stopifnot(all(names(indicators) %in% names(out)))
  out
}
```
# The WGI Framework
## The six dimensions
The WGI report institutional quality along six dimensions, which the World Bank
groups into three pairs:
| | Dimension | What it is meant to capture |
|---|---|---|
| **Process by which governments are selected and replaced** | Voice and Accountability (`va`) | Political participation, freedom of expression, media independence |
| | Political Stability and Absence of Violence (`pv`) | Likelihood of destabilisation or politically motivated violence |
| **Capacity to formulate and implement policy** | Government Effectiveness (`ge`) | Quality of public services, bureaucracy, policy implementation |
| | Regulatory Quality (`rq`) | Ability to formulate and implement sound private-sector policies |
| **Respect for the institutions governing interaction** | Rule of Law (`rl`) | Confidence in legal rules, property rights, police, and courts |
| | Control of Corruption (`cc`) | Extent to which public power is not exercised for private gain |
: The six WGI dimensions and their abbreviations {#tbl-wgi-dimensions}
## How the scores are built
None of these dimensions is measured directly. Each is a **composite** built
from dozens of underlying sources, of four broad kinds:
- **Expert assessments** from think tanks, risk-rating firms, and NGOs
- **Firm surveys** on the regulatory environment and on bribery
- **Household surveys** on public services and on experience of corruption
- **Other indices**, such as press-freedom rankings
These are combined using an **Unobserved Components Model** [@kaufmannKraayMastruzzi2011].
The model assumes that every source is a noisy signal of the same underlying,
unobserved governance concept, and estimates that concept as a weighted average
in which sources that agree more with the others receive more weight. The
output is a score on an approximate $[-2.5, +2.5]$ scale, standardised so that
the world mean is zero in every year, together with a standard error.
::: {.callout-important}
## The scale is relative, not absolute
Because the distribution is re-standardised each year, a country whose score
stays at 0.4 has not "stayed the same" — it has kept its position relative to
the rest of the world. The WGI are therefore poorly suited to claims about
global trends in governance, and comparisons over long time spans need care.
:::
::: {.callout-note .level-advanced}
## 🎓 MA / PhD
The Unobserved Components Model earns its weights from inter-source agreement,
which is exactly what makes the exercise circular when the sources are not
independent. Many underlying assessments are produced by analysts who read each
other's reports and who know a country's reputation, its credit rating, and its
income level. Correlated measurement error of this kind is indistinguishable,
inside the model, from genuine agreement about an underlying truth — so it
inflates the apparent precision of the estimate.
@langbeinKnack2010 push the point further and ask whether the six dimensions
are separable at all. They find that the data are consistent with a single
underlying factor, and argue that the six-dimension presentation implies a
structure the statistics do not support. @thomas2010 raises the prior question
of construct validity: the model tells you how consistent the sources are with
each other, not whether any of them measures "governance" — for that one needs
an argument external to the data. @arndtOman2006 add that the year-to-year
changes in a country's score are frequently smaller than the confidence
interval around them, which is a problem for any use that rewards or penalises
countries for movements in their rank.
:::
# Whose Governance? The Theory Behind the Index
## Two traditions in institutional economics
To see what the WGI commit to, it helps to have two contrasting accounts of
what institutions *are* in view. Both are live traditions in economics, and
they ask different questions.
**New Institutional Economics (NIE)** treats institutions as "the rules of the
game in a society" — the humanly devised constraints that shape interaction
[@north1990]. Its central question is how those rules reduce **transaction
costs** and make exchange possible: secure property rights, enforceable
contracts, predictable regulation, low expropriation risk. Institutions are
assessed functionally, by how efficiently they support market exchange, and
better institutions are expected to produce more investment and faster growth.
**Original (or Old) Institutional Economics (OIE)**, in the tradition running
from Veblen and Commons to @hodgson2006, treats institutions as socially
embedded systems of rules, habits, and power relations that constitute economic
behaviour rather than merely constraining it. Its central questions are about
**power and distribution**: whose interests a given rule serves, how
institutions are reproduced and contested, and how they change. On this view
there is no institutional arrangement that is efficient in general — only
arrangements that are advantageous to some parties, in some context, for some
purpose.
The difference matters here because an indicator has to pick one. A measure
built on NIE premises will score highly a state that enforces contracts
cheaply; a measure built on OIE premises would want to know who wrote the
contracts.
## Exercise: mapping the dimensions
::: {.callout-tip}
## Exercise
Work through @tbl-wgi-dimensions one dimension at a time and fill in the table
below. For each dimension, ask: what would an NIE account emphasise here? What
would an OIE account want to know that the dimension does not report? And what
institutional feature does the dimension leave out altogether?
| WGI dimension | NIE focus (property rights, contracts, transaction costs) | OIE concerns (power, embeddedness, distribution) | Missing aspects |
|---|---|---|---|
| Rule of Law | | | |
| Regulatory Quality | | | |
| Government Effectiveness | | | |
| Control of Corruption | | | |
| Voice and Accountability | | | |
| Political Stability | | | |
:::
::: {.callout-note}
## Possible solution
| WGI dimension | NIE focus | OIE concerns | Missing aspects |
|---|---|---|---|
| Rule of Law | Strong focus on protection of property rights and contract enforcement | Little attention to whose interests the law serves, or to power asymmetries in access to it | Labour rights, collective bargaining institutions |
| Regulatory Quality | Emphasis on private-sector-friendly policy and low business cost | Distributional effects invisible; market solutions treated as the benchmark | Industrial policy, state capacity for structural transformation |
| Government Effectiveness | Efficient service delivery and bureaucratic quality | Democratic input into what services are delivered is not part of the score | Welfare-state institutions, participatory administration |
| Control of Corruption | Rent-seeking as a transaction cost to be minimised | Focus on individual transgression rather than systemic capture | Lobbying, campaign finance, revolving doors — legal influence |
| Voice and Accountability | Mainly procedural: elections, free press | Some attention to participation, though thinly | Economic democracy, worker voice, political inequality |
| Political Stability | Predictable environment for investment | Status-quo bias: legitimate grievance and disruptive reform both lower the score | Social movements, transformative institutional change |
**The pattern.** The WGI track NIE concerns closely and OIE concerns barely.
This is not a flaw in the statistics; it is the concept the index was built to
measure. The framework grew out of the "good governance" agenda of the 1990s,
whose reform template @chang2011 calls the *Global Standard Institutions* — a
specific set of Anglo-American arrangements presented as universally
appropriate, and, he argues, not the set that today's rich countries actually
used while they were developing.
:::
## What the index encodes, and what it omits
The exercise above makes four commitments visible:
- **A market-friendly benchmark.** Regulatory Quality rewards policy that
lowers costs to private business. Regulation protecting workers, consumers,
or ecosystems enters, if at all, as a cost.
- **A liberal-democratic template.** Voice and Accountability is built around
Western electoral and media institutions, and reads other forms of
participation poorly.
- **A stability bias.** Political Stability penalises disruption as such,
including disruption that is a response to injustice, which can flatter
orderly authoritarian regimes.
- **Transgression rather than structure.** Control of Corruption is oriented to
identifiable illegal acts, and largely misses the legal channels through
which concentrated interests shape policy.
And a corresponding set of institutional domains receives little weight
anywhere in the index: labour relations and social insurance, industrial and
innovation policy, environmental governance, and the formal and informal rules
governing gender relations.
None of this makes the WGI useless. It makes them an indicator *of something in
particular*, and the methods-section question is whether that something is what
your research question is about.
# Getting the Data into R
## Downloading the estimates
The WGI live in their own World Bank database (source `3`), not in the World
Development Indicators. That means the `WDI()` function will not find them —
`WDI()` queries source 2 — and the indicator codes are prefixed, e.g.
`GOV_WGI_CC.EST` for the Control of Corruption estimate. Each dimension also
publishes a percentile rank (`.SC`), a standard error (`.SE`), the number of
sources (`.SR`), and the bounds of a 90% confidence interval (`.SC_LB`,
`.SC_UB`).
```{r}
#| label: wgi-download
#| code-summary: "Downloading the WGI from the World Bank API"
#| eval: false
library(jsonlite)
options(timeout = 300)

wgi_codes <- c(va = "VA", pv = "PV", ge = "GE", rq = "RQ", rl = "RL", cc = "CC")

fetch_wgi <- function(code, start, end) {
  url <- paste0(
    "https://api.worldbank.org/v2/country/all/indicator/GOV_WGI_", code, ".EST",
    "?source=3&format=json&per_page=20000&date=", start, ":", end
  )
  raw <- fromJSON(url)[[2]]
  tibble(
    iso3c = raw$countryiso3code,
    year  = as.integer(raw$date),
    value = raw$value
  ) |>
    # Nine entities (Anguilla, Jersey, Taiwan, …) are returned without an ISO-3
    # code and would collide with each other when the data are pivoted wide
    filter(iso3c != "")
}

wgi_long <- imap_dfr(wgi_codes, \(code, nm) {
  fetch_wgi(code, 2000, 2024) |> mutate(indicator = nm)
})

# The API returns regional and income aggregates alongside countries; WDI's
# country table is the cleanest way to drop them
countries <- WDI::WDI_data$country |>
  as_tibble() |>
  filter(region != "Aggregates") |>
  select(iso3c, country, region, income)

wgi_long |>
  pivot_wider(names_from = indicator, values_from = value) |>
  inner_join(countries, by = "iso3c") |>
  select(country, iso3c, region, income, year, va, pv, ge, rq, rl, cc) |>
  filter(if_any(va:cc, \(x) !is.na(x))) |>
  arrange(country, year) |>
  write_csv("data/wgi-estimates.csv")
```
```{r}
#| label: wgi-read
wgi <- read_csv("data/wgi-estimates.csv", show_col_types = FALSE) |>
  mutate(governance_avg = rowMeans(pick(va:cc), na.rm = TRUE))

dimension_labels <- c(
  va = "Voice & Accountability",
  pv = "Political Stability",
  ge = "Government Effectiveness",
  rq = "Regulatory Quality",
  rl = "Rule of Law",
  cc = "Control of Corruption"
)
```
```{r}
#| label: tbl-wgi-structure
#| tbl-cap: "Structure of the cached WGI file: one row per country and year, one column per dimension."
wgi |>
  filter(year == 2022) |>
  slice_head(n = 6) |>
  select(country, iso3c, year, va, pv, ge, rq, rl, cc, governance_avg) |>
  kable(digits = 2) |>
  kable_styling(bootstrap_options = c("striped", "hover"))
```
The file covers `r dplyr::n_distinct(wgi$iso3c)` countries. Note that the years
are not consecutive: the WGI were produced biennially until 2002 and annually
since.
::: {.callout-warning}
## `governance_avg` is a convenience, not an official indicator
The unweighted mean of the six dimensions used throughout this page is a
shortcut for exposition. The World Bank does not publish it, and averaging six
scores that are already composites compounds the aggregation problem rather
than solving it. For actual work, report the dimension your argument is about.
:::
## Working with the uncertainty measures
The estimate is only half of what the WGI publish. Each score comes with a
standard error (`.SE`), and each percentile rank with the bounds of a 90%
confidence interval. These are not decoration: for many country pairs, the
intervals overlap so heavily that the ranking between them carries no
information at all.
This page uses the estimates alone to keep the code readable. If you use the
WGI in your own work, download the `.SE` series alongside `.EST` — the download
function above needs only a different suffix — and check whether the
differences you want to interpret survive their confidence intervals.
# Exploring the Indicators
## Trends over time
```{r}
#| label: fig-wgi-trends
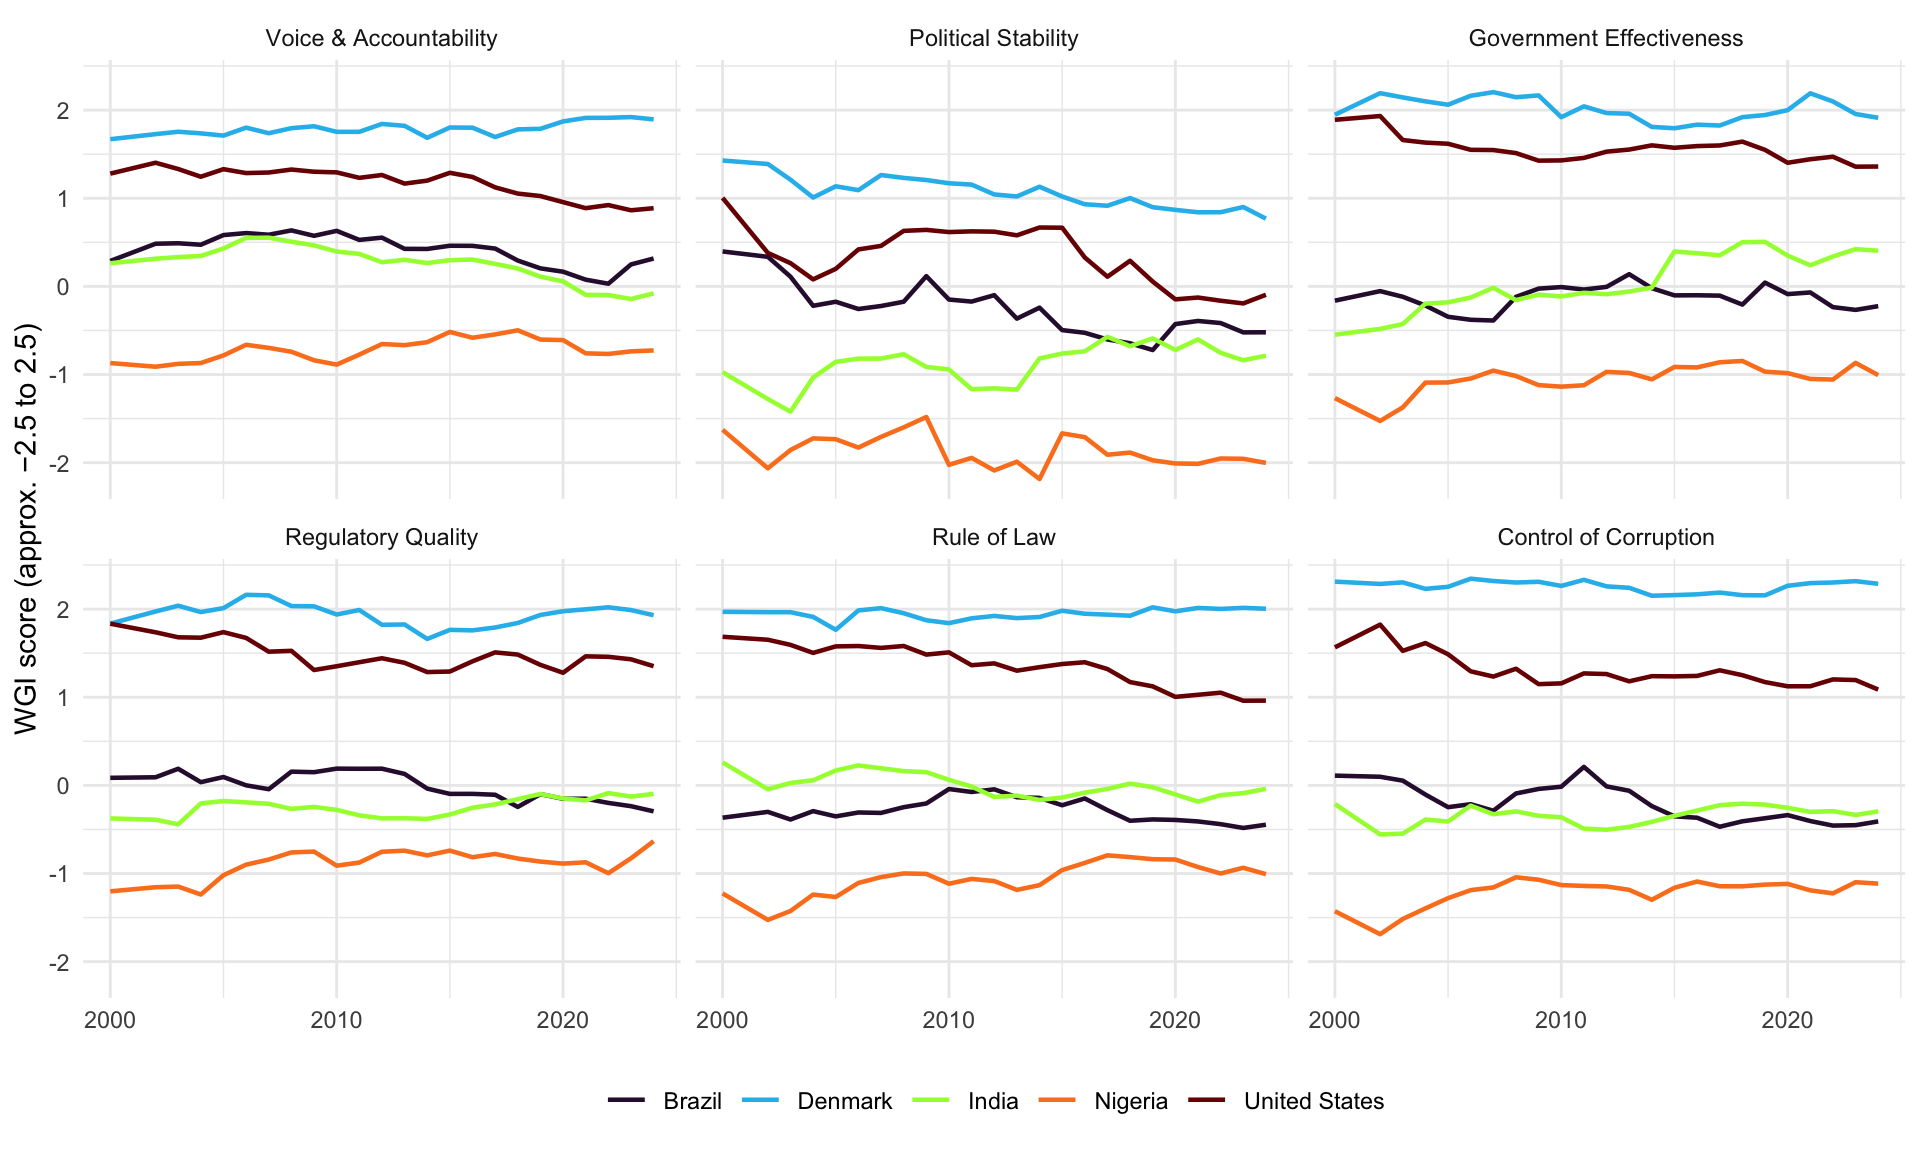
#| fig-cap: "WGI dimensions for five countries, 2000–2024. Remember that the scale is re-standardised each year, so a flat line means a constant position relative to the world, not constant institutional quality."
#| fig-width: 10
#| fig-height: 6
selected <- c("DNK", "USA", "BRA", "IND", "NGA")

wgi |>
  filter(iso3c %in% selected) |>
  pivot_longer(va:cc, names_to = "indicator", values_to = "score") |>
  # Keep the World Bank's own ordering of the dimensions, not alphabetical
  mutate(indicator = factor(dimension_labels[indicator],
                            levels = dimension_labels)) |>
  ggplot(aes(x = year, y = score, colour = country)) +
  geom_line(linewidth = 0.8) +
  facet_wrap(~indicator) +
  scale_x_continuous(breaks = c(2000, 2010, 2020)) +
  scale_colour_viridis_d(option = "H") +
  labs(
    x = NULL,
    y = "WGI score (approx. −2.5 to 2.5)",
    colour = NULL
  ) +
  theme_minimal() +
  theme(legend.position = "bottom")
```
## How much independent information do six dimensions carry?
@tbl-wgi-correlation reports the correlations between the six dimensions across
countries, using each country's average over the whole period.
```{r}
#| label: wgi-correlations
#| code-summary: "Between-country and within-country correlation matrices"
# Between: one observation per country, so the variation is cross-sectional
wgi_country_means <- wgi |>
  summarise(across(va:cc, \(x) mean(x, na.rm = TRUE)), .by = c(country, iso3c))

cor_between <- cor(wgi_country_means |> select(va:cc), use = "complete.obs")

# Within: subtract each country's own mean, leaving only movement over time.
# This is the same transformation a fixed-effects model applies.
wgi_within <- wgi |>
  filter(if_all(va:cc, \(x) !is.na(x))) |>
  mutate(across(va:cc, \(x) x - mean(x, na.rm = TRUE)), .by = iso3c)

cor_within <- cor(wgi_within |> select(va:cc), use = "complete.obs")
```
```{r}
#| label: tbl-wgi-correlation
#| tbl-cap: "Correlations between the WGI dimensions across countries (country means, 2000–2024)."
cor_between |>
  as.data.frame() |>
  rownames_to_column("Dimension") |>
  mutate(Dimension = dimension_labels[Dimension]) |>
  kable(digits = 2, col.names = c("Dimension", "VA", "PV", "GE", "RQ", "RL", "CC")) |>
  kable_styling(bootstrap_options = c("striped", "hover"))
```
Government Effectiveness, Regulatory Quality, Rule of Law, and Control of
Corruption move together very closely across countries — every pairwise
correlation in that block is above 0.9. Whatever the six dimensions separate
conceptually, four of them are close to interchangeable empirically, which is
the statistical version of @langbeinKnack2010's argument and a good reason not
to put two of them on the right-hand side of the same regression.
## Between countries versus within countries
A correlation computed on country means answers a **between-country** question:
do countries that score well on one dimension score well on the others? A
different question is whether the dimensions move together **within** a country
over time. The two can differ sharply, and conflating them is a common mistake.
To separate them, subtract each country's own mean from its observations and
correlate the deviations — the `wgi_within` object above. What remains is the
within-country variation, which is exactly what a fixed-effects model uses; see
[Panel Data and Fixed Effects in R](panel-data-fixed-effects.qmd).
```{r}
#| label: tbl-wgi-within
#| tbl-cap: "Average correlation between the six dimensions, computed between countries and within countries over time."
mean_offdiag <- function(m) mean(m[upper.tri(m)])
min_offdiag  <- function(m) min(m[upper.tri(m)])
max_offdiag  <- function(m) max(m[upper.tri(m)])

tibble(
  Comparison = c(
    "Between countries (country means)",
    "Within countries (deviations from country mean)"
  ),
  `Mean correlation` = c(mean_offdiag(cor_between), mean_offdiag(cor_within)),
  `Lowest pair`      = c(min_offdiag(cor_between), min_offdiag(cor_within)),
  `Highest pair`     = c(max_offdiag(cor_between), max_offdiag(cor_within))
) |>
  kable(digits = 2) |>
  kable_styling(bootstrap_options = c("striped", "hover"), full_width = FALSE)
```
```{r}
#| label: fig-wgi-correlation
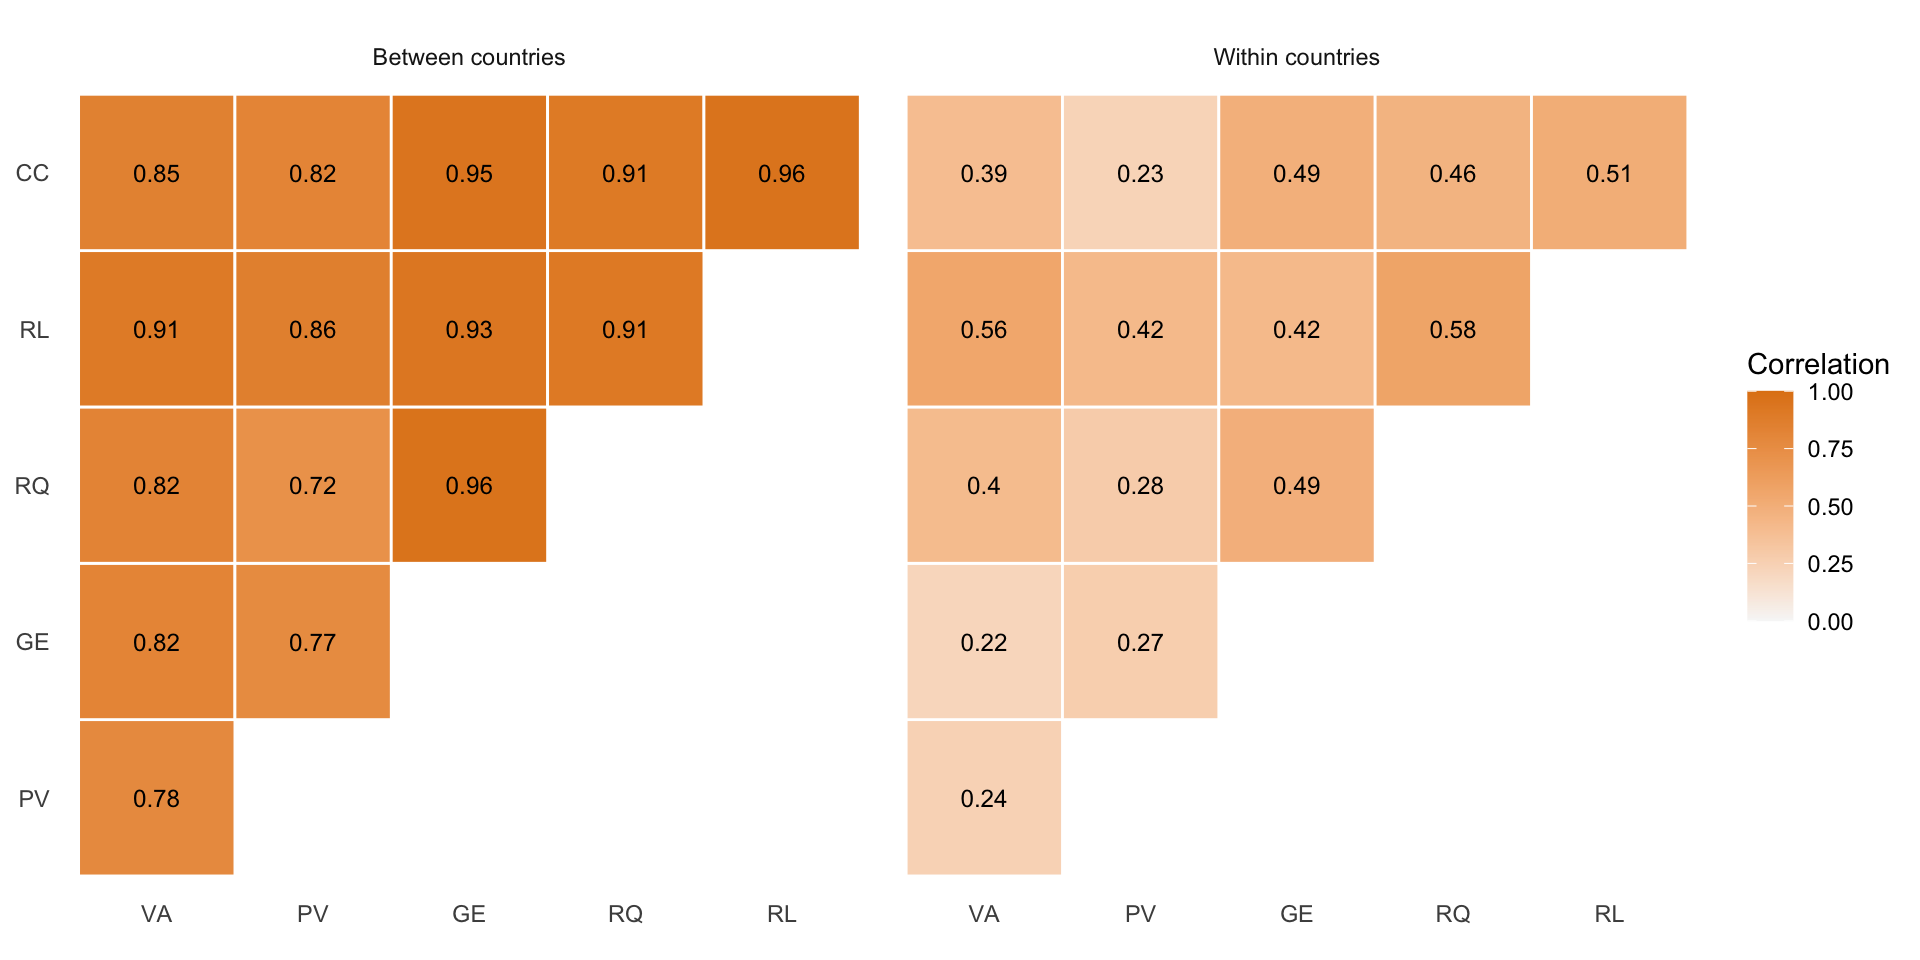
#| fig-cap: "The two correlation matrices side by side, on a shared scale. Between countries (left) every pair is above 0.7; within countries (right) the same pairs fall to between 0.2 and 0.6."
#| fig-width: 10
#| fig-height: 5
as_long <- function(m, label) {
  m |>
    as.data.frame() |>
    rownames_to_column("var1") |>
    pivot_longer(-var1, names_to = "var2", values_to = "correlation") |>
    mutate(
      var1  = factor(var1, levels = names(dimension_labels)),
      var2  = factor(var2, levels = names(dimension_labels)),
      panel = label
    ) |>
    filter(as.integer(var1) < as.integer(var2))
}

bind_rows(
  as_long(cor_between, "Between countries"),
  as_long(cor_within, "Within countries")
) |>
  mutate(panel = factor(panel, levels = c("Between countries", "Within countries"))) |>
  ggplot(aes(x = var1, y = var2, fill = correlation)) +
  geom_tile(colour = "white", linewidth = 0.5) +
  geom_text(aes(label = round(correlation, 2)), size = 3.2) +
  facet_wrap(~panel) +
  scale_fill_gradient(low = "#f7f7f7", high = "#e08214", limits = c(0, 1)) +
  # toupper() as a function maps each level to its own label; a positional
  # vector would misalign, since the dropped diagonal leaves five levels per axis
  scale_x_discrete(labels = toupper) +
  scale_y_discrete(labels = toupper) +
  labs(x = NULL, y = NULL, fill = "Correlation") +
  theme_minimal() +
  theme(panel.grid = element_blank(), axis.ticks = element_blank()) +
  coord_fixed()
```
The between-country correlations are roughly twice the within-country ones.
The near-collinearity of the WGI is therefore a **cross-sectional** phenomenon:
rich, stable countries score well on everything and poor, unstable ones score
badly on everything, and that single contrast dominates the variance. Once you
look at how a given country's scores change over time, the dimensions come
apart considerably. Voice and Accountability and Government Effectiveness
correlate at `r round(cor_between["va", "ge"], 2)` between countries but only
`r round(cor_within["va", "ge"], 2)` within them: countries do lose ground on
political voice while their bureaucracies hold up, and the reverse.
::: {.callout-important}
## Why this distinction is worth the trouble
If you run a cross-section, the WGI will behave as one variable no matter how
many dimensions you enter. If you exploit within-country variation, they carry
more independent information — but the year-to-year movements are also where
the measurement error is largest relative to the signal, so more of what you
are modelling may be noise. Each design comes with costs.
:::
# Governance and Development Outcomes
## The bivariate picture
The empirical claim that made institutional quality a central variable in
development economics is that good institutions cause growth
[@acemogluJohnsonRobinson2001]. The raw correlation is easy to reproduce. We
pull three outcomes from the WDI, average them over 2018–2022 to match the
governance data, and join on ISO-3 codes.
```{r}
#| label: outcomes-data
outcomes <- wdi_cached(
  indicators = c(
    gdp_pc_ppp = "NY.GDP.PCAP.PP.CD",
    gini       = "SI.POV.GINI",
    life_exp   = "SP.DYN.LE00.IN"
  ),
  file  = "wdi-governance-outcomes.csv",
  start = 2018,
  end   = 2022
) |>
  summarise(
    across(c(gdp_pc_ppp, gini, life_exp), \(x) mean(x, na.rm = TRUE)),
    .by = iso3c
  )

governance_outcomes <- wgi |>
  filter(year >= 2018, year <= 2022) |>
  summarise(governance_avg = mean(governance_avg, na.rm = TRUE),
            .by = c(country, iso3c, region)) |>
  inner_join(outcomes, by = "iso3c")
```
Joining on `iso3c` rather than on the country name is not a stylistic
preference. The WGI call the country `Egypt, Arab Rep.` in some vintages and
`Egypt` in othersm, while the WDI use their own spellings.
A name join silently drops the rows that disagree, and produces a silently shorter
dataset is a common error source, and you should be aware of it.
```{r}
#| label: fig-governance-outcomes
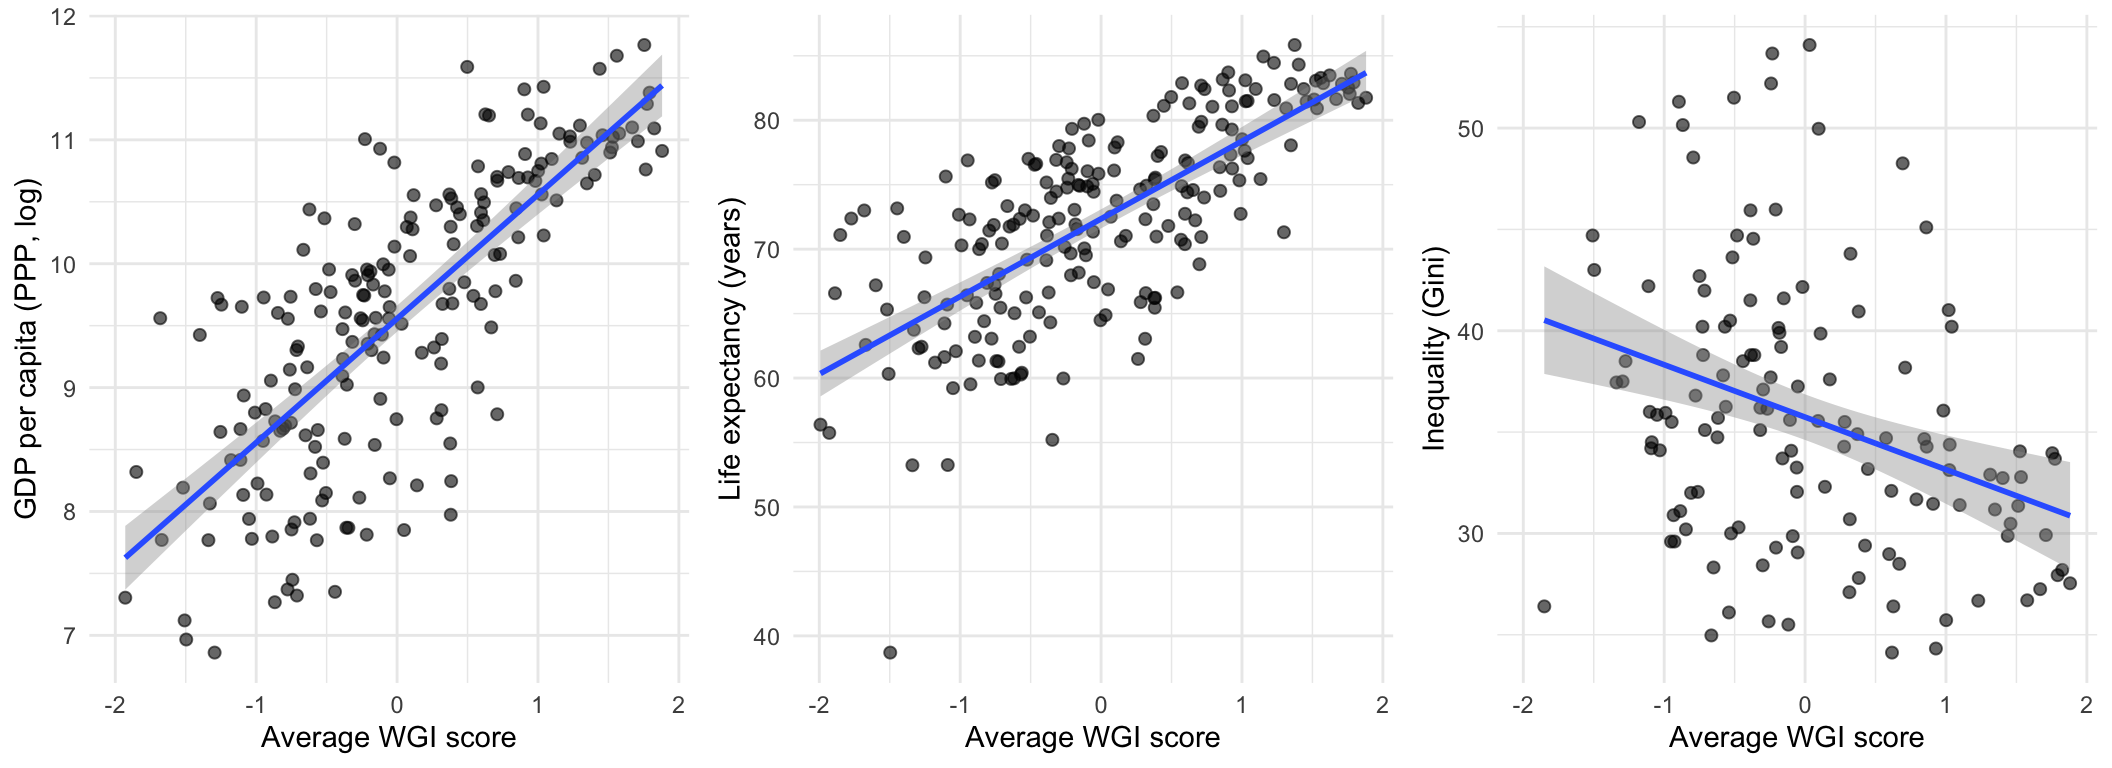
#| fig-cap: "Average WGI score against three development outcomes, 2018–2022 averages. Each point is a country."
#| fig-width: 11
#| fig-height: 4
plot_outcome <- function(data, yvar, ylab) {
  ggplot(data, aes(x = governance_avg, y = {{ yvar }})) +
    geom_point(alpha = 0.6, size = 1.8) +
    geom_smooth(method = "lm", formula = y ~ x, se = TRUE) +
    labs(x = "Average WGI score", y = ylab) +
    theme_minimal()
}

ggarrange(
  plot_outcome(governance_outcomes, log(gdp_pc_ppp), "GDP per capita (PPP, log)"),
  plot_outcome(governance_outcomes, life_exp, "Life expectancy (years)"),
  plot_outcome(governance_outcomes, gini, "Inequality (Gini)"),
  ncol = 3, nrow = 1
)
```
Governance scores correlate strongly and positively with income and life
expectancy. The association with the Gini coefficient is negative — higher
governance scores go with *lower* measured inequality — but it is much weaker
and much noisier than the other two, and the Gini is available for far fewer
countries. That weakness is itself informative: an index built around contract
enforcement and regulatory predictability has no particular reason to track
distribution, and it does not.
## What the correlation cannot tell you
@fig-governance-outcomes is consistent with at least four stories. But the
info from the figure is, unfortunately, unable to distinguishes them:
1. **Institutions cause development** — the NIE claim, and the reading
@acemogluJohnsonRobinson2001 defend with an instrumental-variables strategy
precisely because the raw correlation cannot settle it.
2. **Development causes institutions** — rich states can afford professional
bureaucracies, well-paid judges, and functioning statistical offices.
3. **Something else causes both** — colonial history, geography, or the
structure of the export basket, which is the mechanism explored in
[Income, Output, and Complexity Indicators](income-output-and-complexity-indicators.qmd).
4. **The measurement is partly circular** — assessors who rate governance know
how rich a country is. @kaufmannKraayMastruzzi2011 acknowledge the risk;
@arndtOman2006 argue it is substantial. To the extent that perceptions of
institutional quality are formed partly by observed prosperity, part of this
correlation is built into the indicator rather than discovered by it.
Story 4 is the one specific to indicator-based work, and the one most often
ignored. Distinguishing the first three requires an identification strategy —
see [Reasoning with DAGs](reasoning-with-dags.qmd) for how to state what your
design assumes, and
[Panel Data and Fixed Effects in R](panel-data-fixed-effects.qmd) for the most
common way of exploiting within-country variation.
# How the WGI Are Used
Knowing where these numbers end up is part of knowing what they are.
**Aid allocation and eligibility.** The United States' Millennium Challenge
Corporation uses Control of Corruption and Rule of Law among its eligibility
indicators, so the scores have a direct budgetary consequence. Multilateral
development banks use governance ratings in country allocation formulas, and
several donors report against them.
**Investment and credit risk.** Sovereign risk models and country-risk products
draw on the WGI directly. This creates a feedback loop worth naming: an index
partly built from expert perceptions feeds into ratings that shape those same
experts' views of a country.
**Academic research.** The WGI are among the most frequently used variables in
cross-country empirical work, typically as a control for institutional quality
or as the outcome of interest. @tbl-wgi-correlation is the reason to be careful
here: entering three or four dimensions as separate regressors imports severe
multicollinearity, and picking whichever single dimension supports the
hypothesis is a specification search.
**Policy targeting.** Governments do set targets in terms of WGI rank.
Because the scores are re-standardised annually and the confidence intervals
are wide, rank movements are frequently not statistically distinguishable from
zero, which makes them poor targets — and, as @arndtOman2006 note, creates an
incentive to manage perceptions rather than institutions.
# Summary
- The WGI report six dimensions of governance, each a composite of dozens of
expert, firm, and household assessments aggregated by an Unobserved
Components Model that weights sources by their agreement with each other.
- The scale is **relative and re-standardised every year**, so scores describe
position in the world distribution, not an absolute level.
- Across countries, four of the six dimensions are nearly interchangeable;
within countries over time they carry considerably more independent
information. Which fact applies to you depends on your research design.
- The index encodes a specific, NIE-flavoured conception of good governance —
property rights, contract enforcement, regulatory predictability — and gives
little weight to labour, welfare, industrial-policy, environmental, and
gender institutions.
- Governance scores correlate strongly with income and life expectancy and
weakly with inequality. The correlation with income is compatible with
causation in either direction, with common causes, and with partial
circularity in the measurement itself.
- Use the uncertainty measures the WGI publish. A difference smaller than its
confidence interval is not a finding.
# Further Reading
- @kaufmannKraayMastruzzi2011 — the authors' own account of the methodology and
their reply to the main criticisms. Start here; it is more candid about the
limitations than most secondary discussions suggest.
- @langbeinKnack2010 — the case that the six dimensions measure one thing.
- @thomas2010 — the construct-validity question: do the WGI measure what they
claim to measure, and how would we know?
- @arndtOman2006 — a book-length treatment of how governance indicators are
used and misused, with particular attention to aid allocation.
- @chang2011 — institutional quality from a development-policy and economic-history
perspective, and the source of the "Global Standard Institutions" critique.
- @hodgson2006 — what an institution is, from the OIE side.
- @north1990 — the founding statement of the NIE position.
# References {.unnumbered}
::: {#refs}
:::