flowchart TD
    A["<b>1. Concept</b><br/>Development, wellbeing,<br/>sustainability, democracy"]
    B["<b>2. Conception</b><br/>Which dimensions count?<br/>Output? Capabilities?<br/>Distribution?"]
    C["<b>3. Indicator</b><br/>Which observable proxy<br/>for each dimension?"]
    D["<b>4. Aggregation</b><br/>Normalization, weighting,<br/>functional form"]
    E["<b>A number</b><br/>in a dataset"]
    A --> B --> C --> D --> E
The Theory-Ladenness of Observation
epistemology
measurement
indicators
research-design
R
concept
BA
MA
Why there is no such thing as a neutral measurement: how theoretical commitments enter every indicator through the choices of concept, operationalization, normalization, and aggregation — and what this means for empirical work.
1 Introduction
Empirical research is often described as a two-stage process: first you observe the world, then you interpret what you saw. Theory enters at the second stage; the first stage is supposed to be neutral. On this picture, disagreements between researchers are disagreements about interpretation, and they can in principle be settled by going back to the data.
This picture is wrong, and understanding why it is wrong is one of the more useful things you can learn before doing empirical work. The observations themselves already contain theory. What you count as an observation, which features of the world you record, which you ignore, and how you combine what you recorded into a single number — all of this rests on prior commitments about what matters. The philosopher of science Norwood Russell Hanson gave this the name it still carries: observation is theory-laden.
This page explains what the claim means, shows you the specific points at which theory enters a quantitative indicator, and then demonstrates the consequences empirically. The demonstration uses development indicators, because development is a concept where the disagreements are unusually visible — but nothing in the argument is specific to development economics. The same structure applies to measuring wellbeing, sustainability, democracy, institutional quality, poverty, innovation, or any other concept that is contested rather than directly observable.
NoteWhat this page is not claiming
Theory-ladenness is not the claim that data are unreliable, that all measurements are equally good, or that empirical research is futile. Indicators can be more or less well constructed, more or less transparent, more or less appropriate for a given question. The claim is narrower and sharper: there is no neutral vantage point from which to measure, so the choice of indicator is itself a substantive claim that has to be argued for — not a technical preliminary that can be delegated to whatever happens to be available.
2 What Theory-Ladenness Means
2.1 The basic argument
Consider the seemingly innocent statement: “Country A is more developed than Country B.” To check this against data, you need a number for each country. To get a number you need an indicator. And to choose an indicator, you must already have decided what development is. If you take development to be material output, you will reach for GDP per capita. If you take it to be the expansion of people’s real freedoms (Sen 2000), you will reach for something like the Human Development Index or a capability-based measure. If you take it to be the accumulation of productive capabilities, you will reach for economic complexity.
These are not three different ways of measuring the same thing. They are three different things, corresponding to three different theories of what development is. The data cannot arbitrate between them, because you need one of them before you can generate the data.
That is the core of the argument. Theory does not merely interpret observations after the fact; it determines which observations get made in the first place.
2.2 Why this is not a defect
It is tempting to read this as a problem to be solved — as if a sufficiently careful researcher could strip out the theory and get to the raw facts. But there are no raw facts about development. “Development” is not a property you can point at; it is a concept that organizes a set of concerns. The same holds for most of the interesting concepts in the social sciences.
The practical consequence is not despair but discipline. Since you cannot avoid making theoretical commitments, you should:
- Make them explicit. State what you take the concept to mean before you choose how to measure it.
- Choose the indicator from the question, not from the data. The most common failure in student work — and in a good deal of published work — is to run the chain backwards: find a dataset, then retrofit a research question to what the dataset happens to contain.
- Check robustness across indicators. If your conclusion holds under several reasonable operationalizations, it is more credible. If it flips, you have learned something important about how much your finding depends on a contestable choice.
- Report the choice as a finding, not as housekeeping. “We use GDP per capita” is not a methods footnote. It is a claim about what development means.
3 Where Theory Enters: The Operationalization Chain
It helps to be precise about where in the process the discretionary choices sit. Every quantitative indicator can be traced through four steps, and each one involves decisions that could reasonably have gone the other way.
3.1 Step 1: From concept to conception
The concept is the word — “development”. The conception is a specific account of what the word picks out. Amartya Sen’s conception is the expansion of substantive freedoms; a growth-theoretic conception is sustained increases in output per head; a structuralist conception is the transformation of a country’s productive structure. All three are recognizably about development, and they disagree.
Nothing in the data selects between them. This is a normative and theoretical choice, and it should be argued for.
3.2 Step 2: From conception to dimensions
Having fixed a conception, you must decide which dimensions of it to include. The HDI, for instance, adopts a broadly capability-oriented conception but then selects exactly three dimensions: health, education, and income. Why these three? Partly because they are defensible proxies for central capabilities; partly because data for them exist for almost every country and year. Political freedom, environmental quality, and personal security are arguably just as central to the underlying conception, and they are excluded — largely for practical reasons.
Notice what has happened: a data-availability constraint has silently become a theoretical statement about what development consists of. This is extremely common, and it is worth learning to spot.
3.3 Step 3: From dimensions to indicators
Each dimension then needs an observable proxy. “Knowledge” becomes mean and expected years of schooling. But years of schooling measure exposure, not learning: two countries with identical schooling years can have very different educational outcomes. “A decent standard of living” becomes GNI per capita — an average, which by construction says nothing about distribution.
Every proxy captures part of its dimension and misses part. The gap between the dimension and the proxy is where a great deal of criticism of any indicator lives.
3.4 Step 4: From indicators to a single number
Finally, the components must be combined, and this step embeds at least three further choices:
- Normalization. Components measured in years, dollars, and percentages cannot simply be added. Rescaling them to a common range requires picking minimum and maximum values, and the resulting scores depend on that choice.
- Weighting. The HDI weights its three dimensions equally. Equal weighting looks neutral, but there is no neutral weighting: giving health the same weight as income is a substantive position, just an unstated one.
- Functional form. Since 2010 the HDI uses a geometric rather than an arithmetic mean. The switch was deliberate: a geometric mean punishes imbalance across dimensions, so a country cannot fully compensate for poor health with high income. That is a theoretical claim about substitutability between dimensions, encoded as a choice of formula.
Note🎓 MA / PhD
The aggregation step is where the connection to social choice theory becomes explicit. Any composite index is an aggregation rule over dimensions, and the familiar impossibility results apply: there is no aggregation procedure satisfying all reasonable desiderata simultaneously. Sen’s own position was that the HDI was a deliberate vulgarization — a crude index adopted for rhetorical reasons, to displace GNP in public debate, with the full capability approach resisting reduction to a single number at all. When you read a composite index, it is worth asking whether its designers intended it as a measurement or as an intervention in a public argument.
4 Demonstration: The Same Countries, Four Rankings
The argument so far has been conceptual. Let us make it concrete. If theory-ladenness has real consequences, then adopting different conceptions of development should produce different substantive conclusions about the same countries.
We take a set of countries and rank them four times, using four indicators that correspond to four conceptions of what development is:
| Conception | Indicator | World Bank code |
|---|---|---|
| Development as material output | GDP per capita (PPP) | NY.GDP.PCAP.PP.CD |
| Development as a long and healthy life | Life expectancy at birth | SP.DYN.LE00.IN |
| Development as equity | Gini coefficient (inverted) | SI.POV.GINI |
| Development as ecological sustainability | CO₂ emissions per capita (inverted) | EN.GHG.CO2.PC.CE.AR5 |
Each of these has been seriously defended. None of them is a distortion of the others. They simply answer the question “what is development?” differently.
4.1 Getting the data
We use the WDI package, which queries the World Bank API directly. To avoid re-downloading on every render, we wrap the call in a small caching helper: the download happens only if the cached file is absent, and the cached file is what gets read afterwards.
Packages and caching helper
library(WDI)
library(dplyr)
library(tidyr)
library(readr)
library(ggplot2)
library(kableExtra)

#' Download WDI data once, then re-use the cached copy
#'
#' @param indicators Named character vector of World Bank indicator codes
#' @param file Name of the cache file inside `data/`
#' @param ... Further arguments passed to `WDI::WDI()`
wdi_cached <- function(indicators, file, ...) {
  path <- file.path("data", file)
  if (!file.exists(path)) {
    message("Cache miss - downloading from the World Bank API ...")
    write_csv(WDI(indicator = indicators, ...), path)
  }
  out <- read_csv(path, show_col_types = FALSE)
  # Guard against a retired indicator code (which returns silently without its
  # column) and against a cache file written by a different query
  stopifnot(all(names(indicators) %in% names(out)))
  out
}
Code
countries <- c("QA", "US", "NO", "DE", "JP", "KR",
               "CR", "BR", "ZA", "VN", "IN", "ET")

indicators <- c(
  GDPpc = "NY.GDP.PCAP.PP.CD",
  Life  = "SP.DYN.LE00.IN",
  Gini  = "SI.POV.GINI",
  CO2pc = "EN.GHG.CO2.PC.CE.AR5"
)

ranking_raw <- wdi_cached(
  indicators = indicators,
  file       = "wdi-ranking-comparison.csv",
  country    = countries,
  start      = 2015,
  end        = 2023
)
Because Gini coefficients come from household surveys that are not run every year, the series have gaps. We therefore average each indicator over the available years rather than picking a single year — itself a methodological choice worth noting, and one that a critical reader should ask about.
Code
vars <- names(indicators)

ranking <- ranking_raw |>
  summarise(across(all_of(vars), \(x) mean(x, na.rm = TRUE)), .by = country) |>
  filter(if_all(all_of(vars), \(x) !is.nan(x))) |>
  mutate(
    `Output`         = rank(-GDPpc),   # high income  = "developed"
    `Health`         = rank(-Life),    # long life    = "developed"
    `Equity`         = rank(Gini),     # low Gini     = "developed"
    `Sustainability` = rank(CO2pc)     # low emissions = "developed"
  )
NoteA note on
across() and name collisions
Naming the emissions column CO2 rather than CO2pc would break the across(all_of(vars), ...) call, because CO2 is also the name of a dataset in the base datasets package and tidyselect resolves it to that object. This is a generic hazard when you rename columns to short, convenient names — df, t, c, and CO2 are all live names in R. Prefer slightly longer column names.
4.2 The result
Code
ranking |>
  arrange(Output) |>
  select(Country = country, Output, Health, Equity, Sustainability) |>
  kable(digits = 0) |>
kable_styling(full_width = FALSE)| Country | Output | Health | Equity | Sustainability |
|---|---|---|---|---|
| Qatar | 1 | 4 | 7 | 12 |
| Norway | 2 | 3 | 2 | 7 |
| United States | 3 | 7 | 9 | 11 |
| Germany | 4 | 5 | 4 | 8 |
| Korea, Rep. | 5 | 2 | 6 | 10 |
| Japan | 6 | 1 | 3 | 9 |
| Costa Rica | 7 | 6 | 10 | 2 |
| Brazil | 8 | 8 | 11 | 4 |
| South Africa | 9 | 12 | 12 | 6 |
| Viet Nam | 10 | 9 | 8 | 5 |
| India | 11 | 10 | 1 | 3 |
| Ethiopia | 12 | 11 | 5 | 1 |
Code
ranking |>
  select(country, Output, Health, Equity, Sustainability) |>
  pivot_longer(-country, names_to = "conception", values_to = "rank") |>
  mutate(conception = factor(
    conception,
    levels = c("Output", "Health", "Equity", "Sustainability"))) |>
  ggplot(aes(x = conception, y = rank, group = country, colour = country)) +
  geom_line(linewidth = 0.9, alpha = 0.85) +
  geom_point(size = 2.5) +
  scale_y_reverse(breaks = seq_len(nrow(ranking))) +
  scale_colour_viridis_d(option = "H") +
  labs(
    title = "The ranking depends on the conception of development",
    x = NULL, y = "Rank (1 = most developed)", colour = NULL
  ) +
  theme_minimal() +
  theme(panel.grid.minor = element_blank())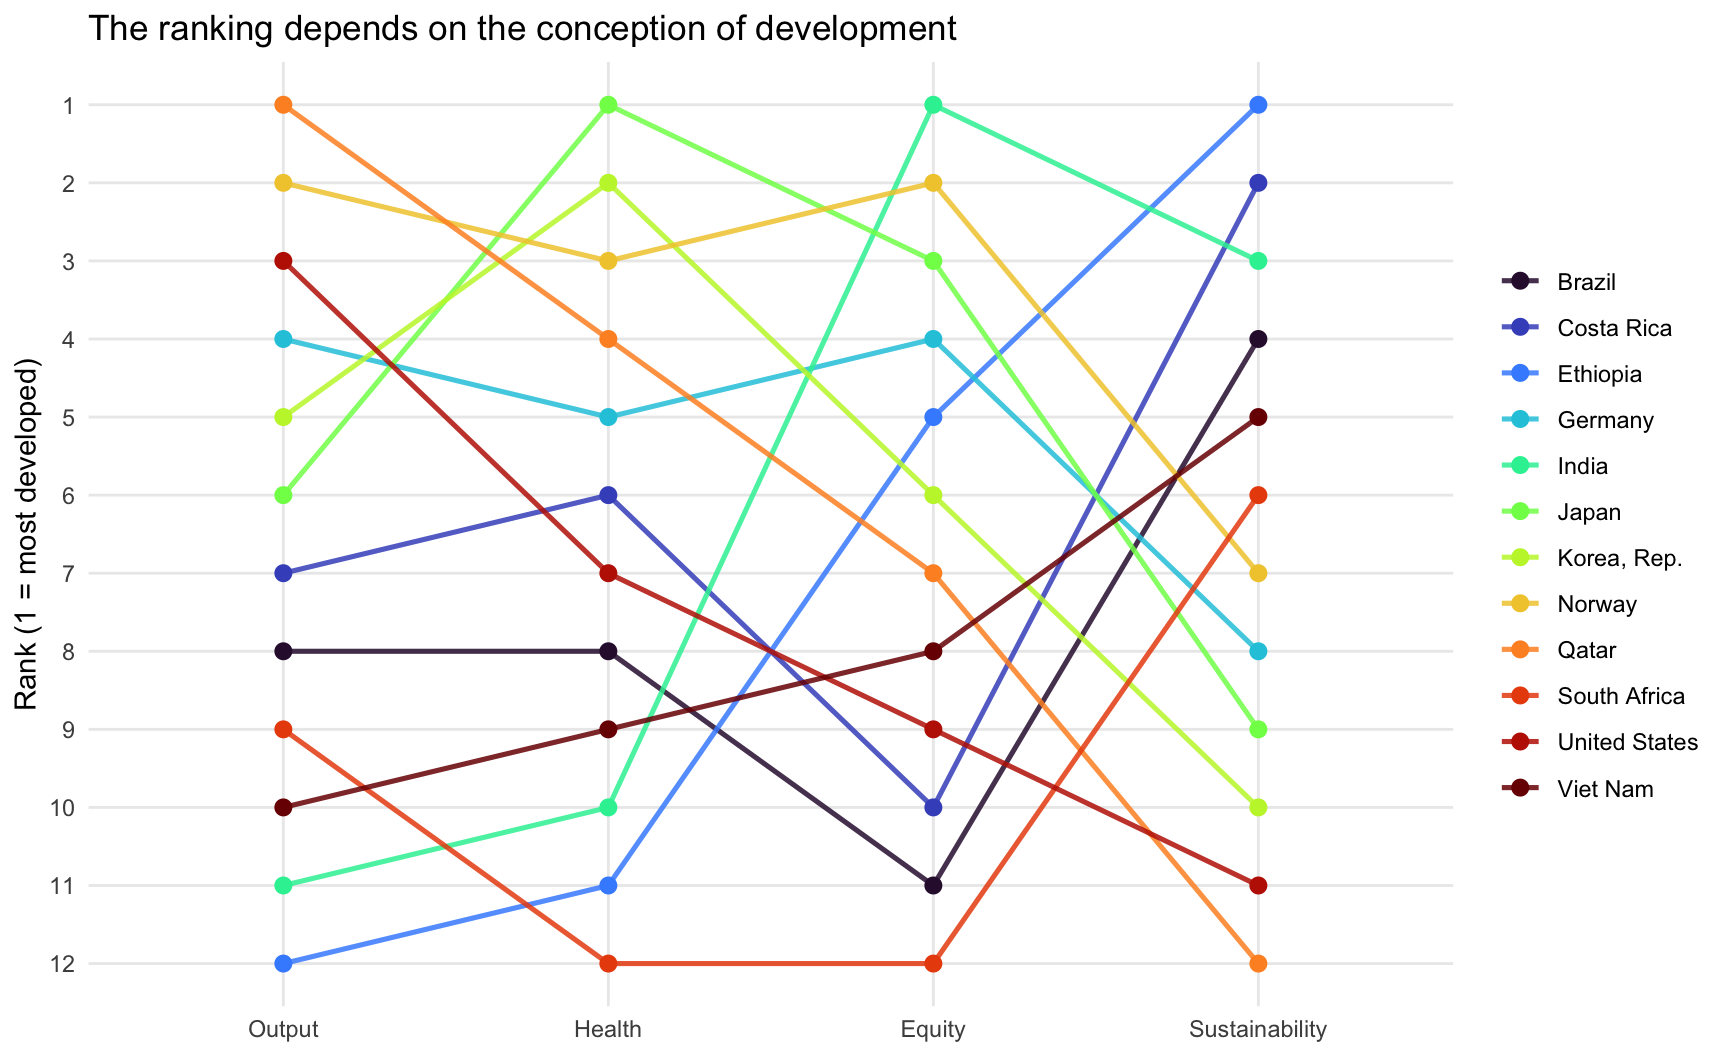
How much do the four orderings actually differ? Rank correlations give a compact answer:
Code
ranking |>
  select(Output, Health, Equity, Sustainability) |>
  cor(method = "spearman", use = "pairwise.complete.obs") |>
  round(2) |>
  kable() |>
kable_styling(full_width = FALSE)| Output | Health | Equity | Sustainability | |
|---|---|---|---|---|
| Output | 1.00 | 0.74 | 0.08 | -0.82 |
| Health | 0.74 | 1.00 | 0.38 | -0.63 |
| Equity | 0.08 | 0.38 | 1.00 | -0.05 |
| Sustainability | -0.82 | -0.63 | -0.05 | 1.00 |
Three things are worth drawing out.
Output and health agree, but only loosely. The correlation is positive and substantial: richer countries do tend to live longer. But the United States ranks well below its income position, and Costa Rica — on roughly a third of US income per head — has the higher life expectancy of the two. Income buys longevity, but the exchange rate between them varies a great deal.
Output and equity are close to unrelated. Knowing a country’s income rank tells you almost nothing about its distributional rank. A conception of development that includes distribution is not a refinement of the output conception; it is a different ordering of the world.
Output and sustainability point in opposite directions. This is the sharpest result: the correlation is strongly negative. Ethiopia is last on output and first on emissions; Qatar is the exact reverse. Under a conception of development as ecological sustainability, the conventional development ranking is close to inverted. Any account of “sustainable development” has to confront this tension rather than assume it away.
ImportantThe numbers are theory-laden too
Look at India’s equity rank. India has one of the lowest Gini coefficients in this sample — lower than Norway’s — which does not match most people’s picture of Indian inequality. The explanation is not that India is unusually equal, but that the World Bank’s Gini for India is computed from a consumption survey, whereas for most high-income countries it is computed from income data. Consumption is distributed far more equally than income, because rich households save a large share of what they earn. The two numbers sit in the same column of the same dataset and are not comparable.
This is theory-ladenness operating one level deeper: not in your choice of indicator, but inside the indicator, in decisions made by the statistical agencies that produced it. Reading the source documentation for an indicator is not optional diligence — it is part of knowing what your number means.
This is the practical content of theory-ladenness. The statement “Country A is more developed than Country B” was never a purely empirical statement. Fixing the conception of development was doing at least as much work as the data.
TipTry it yourself
Replace the country vector with a set of countries relevant to your own work, and add a fifth conception — for example the multidimensional poverty headcount, the share of the population with electricity access (EG.ELC.ACCS.ZS), or the adult literacy rate (SE.ADT.LITR.ZS). Then ask the question that matters: which conception does your research question commit you to, and can you defend that commitment against the alternatives?
5 Working Rules
The upshot for your own empirical work:
Write the conception down before you touch the data. One or two sentences stating what you take the concept to mean. If you cannot write them, you are not ready to choose an indicator.
Justify the indicator by reference to the conception. “GDP per capita is widely available” is not a justification; it is an admission. “GDP per capita is appropriate because my question concerns material productive capacity, not wellbeing” is a justification.
Say what your indicator misses. Every indicator has a known gap between the dimension and the proxy. Naming it is a sign of competence, not weakness.
Run the robustness check. Re-do your analysis under a second reasonable operationalization. If it holds, say so. If it does not, that result is more interesting than the original one.
Read other people’s indicators the same way. When a paper or a policy report states a finding about development, wellbeing, or sustainability, the first question is not “is the estimate precise?” but “what conception is embedded in this measure, and would a different one change the conclusion?”
6 Where to Go From Here
The remaining pages in the Measuring Development track work through the major families of indicators in detail — what each one measures, how it is constructed, where to obtain it, and what it misses:
- Accessing Development Data in R — the practical data-gathering toolkit
- Income, Output, and Complexity Indicators
- Measuring Inequality and Poverty
- Human Development and Social Indicators
Read each of them with the operationalization chain in mind. Every indicator you meet is a set of answers to the four questions above, and the answers are always contestable.
References
Sen, Amartya. 2000. Development as Freedom. Alfred Knopf.
Citation
BibTeX citation:
@inreference{graebner2026-theory-ladenness-of-observation,
  author = {Gräbner-Radkowitsch, Claudius},
  editor = {Gräbner-Radkowitsch, Claudius},
  title = {The {Theory-Ladenness} of {Observation}},
  booktitle = {Method and Inquiry},
  date = {2026-09-16},
  url = {https://euf-methodology-hub.netlify.app/resources/theory-ladenness-of-observation},
  langid = {en}
}
For attribution, please cite this work as:
Gräbner-Radkowitsch, Claudius. 2026. “The Theory-Ladenness of
Observation.” In Method and Inquiry, edited by Claudius
Gräbner-Radkowitsch. September 16. https://euf-methodology-hub.netlify.app/resources/theory-ladenness-of-observation.